Replaced Quarterbacks and Evolving NFL Standards
The quarterback is the most important position in all of football, if not all of sports. There is no one person who has a larger direct impact on scoring than the quarterback does. It is paramount that a team has at least competent quarterback play on their roster if they hope to one day win a title.
In the last month alone, the NFL’s media cycle has revolved around quarterbacks almost exclusively. The New York Jets finally put an end to their monthslong game of footsie with Aaron Rodgers by sending a haul of draft capital to the Green Bay Packers. Three of the top four picks of this year’s draft class were spent on quarterbacks. The Baltimore Ravens’ entire offseason—landing Todd Monken as their offensive coordinator, signing wide receiver Odell Beckham Jr., drafting a first-round receiver, signing Lamar Jackson to a historic extension—has been framed around the idea of Baltimore retaining a generational talent at quarterback. This news cycle is a continuation of the last several years’ worth of offseason headlines dominated by quarterbacks signing record deals, headlining big trades, and dominating draft conversations.
While the splash moves and headlines all focus on the talent worth acquiring, there is a conversation that is arguably more interesting surrounding the quarterbacks who end up getting replaced. In 2021, the Los Angeles Rams felt they needed an upgrade from Jared Goff, who led the team to four straight winning seasons and was two years removed from a Super Bowl berth. Last year, the Seattle Seahawks accepted a massive package to honor Russell Wilson’s trade request, only to make the playoffs without him. This past offseason saw the Raiders release Derek Carr despite being one of only 10 quarterbacks in NFL history with four consecutive years of 4,000 passing yards, per Stathead.
When looking at the kinds of players teams are willing to move on from in pursuit of the next franchise quarterback, it begs the question: has the standard for starting quarterbacks in the league gotten higher?
Methodology
Determining the standards for how teams change starting quarterbacks requires us to define and identify what a “starting quarterback” is. Each NFL team rosters at least two quarterbacks. While there is a typical separation between a starting quarterback and their backup, those labels can sometimes enter a gray area.
The best definition is often the simplest. For this exercise, the starting quarterback is the quarterback who started the most games for their team in the regular season. Pro Football Reference catalogs each team’s individual games played over the history of the league and keeps track of the number of each games each player started. In the event multiple quarterbacks share a plurality of games played over the course of a 16-game season, the quarterback with the better win-loss record will be deemed the starter. It ends up being a rare tiebreaker, but the more winning quarterback has a better chance of starting the following season if all else is equal.
This definition for starting quarterback also helps us identify when a player loses their starting role. Acclimating a new quarterback to a roster—especially a rookie—is an imperfect science. NFL teams will sometimes ease their quarterback into a system, having them sit part of the regular season before allowing them to start games. Some quarterback battles get handled in-season, with coaches opting for the hot hand week-to-week. Leaving the definition of “starting quarterback” simply up to games started gives us a simple way to cut through noise and simplify single-season indecision.
The more challenging exercise is evaluating quarterback talent. Different offenses, varying levels supporting cast, and unique skillsets make it difficult to boil down performance to one catch-all statistic. In an effort to make this as thorough as possible, quarterbacks will be evaluated on three different metrics:
EPA/Play: A relatively objective and reliable metric that accounts for all plays made on the football field. This serves as our tool to evaluate all plays made on the field by a quarterback.
PFF Grade: PFF’s grading system, like EPA/Play, takes every play into account. However, it also provides the added benefit of evaluating qualitative on-field play in a way our other statistics do not.
Passing DVOA: While this has the downside of not counting scrambles and designed run plays(which are included in a quarterback’s rushing DVOA), DVOA presents two unique advantages. 1.) DVOA adjusts for opponent, eliminating some variance in individual seasons. 2.) DVOA allows us to observe performance above or below a season’s average quarterback performance.
The timeframe we will be observing runs from the 2006 regular season to the 2022 regular season. Beginning in 2006 gives us a five-year window before the 2011 collective bargaining agreement, which established the rookie wage scale that made rookie quarterbacks so highly valued. In addition, all 32 teams in the NFL have had at least two quarterbacks start over that period.
While we will use statistical info for 2022 in our models, 2022 starting quarterbacks cannot really be considered “replaced” yet. We can make educated projections about who the upcoming 2023 starters will be, there is no certainty that these projected starters will make it all 17 games. The conclusion of the 2022 season gives us concrete information with which to determine which 2021 quarterbacks definitely lost starting jobs.
Quarterback Growth from 2006-2022
As a jumping-off point, let us establish how quarterback play has evolved at all levels over the course of our established timeframe. Each statistic will be mapped out on a per-year basis at the 90th, 50th, and 25th percentile. This helps to establish some understanding of how starting quarterback performance has evolved at the elite level, median level, and lowest level. Each line graph will be accompanied by a linear trendline with a slope and R². The slope will tell us the general up-or-down movement of the statistic on a per-year basis within our sample size, while our R² determines how well our trendline fits our actual data presented.
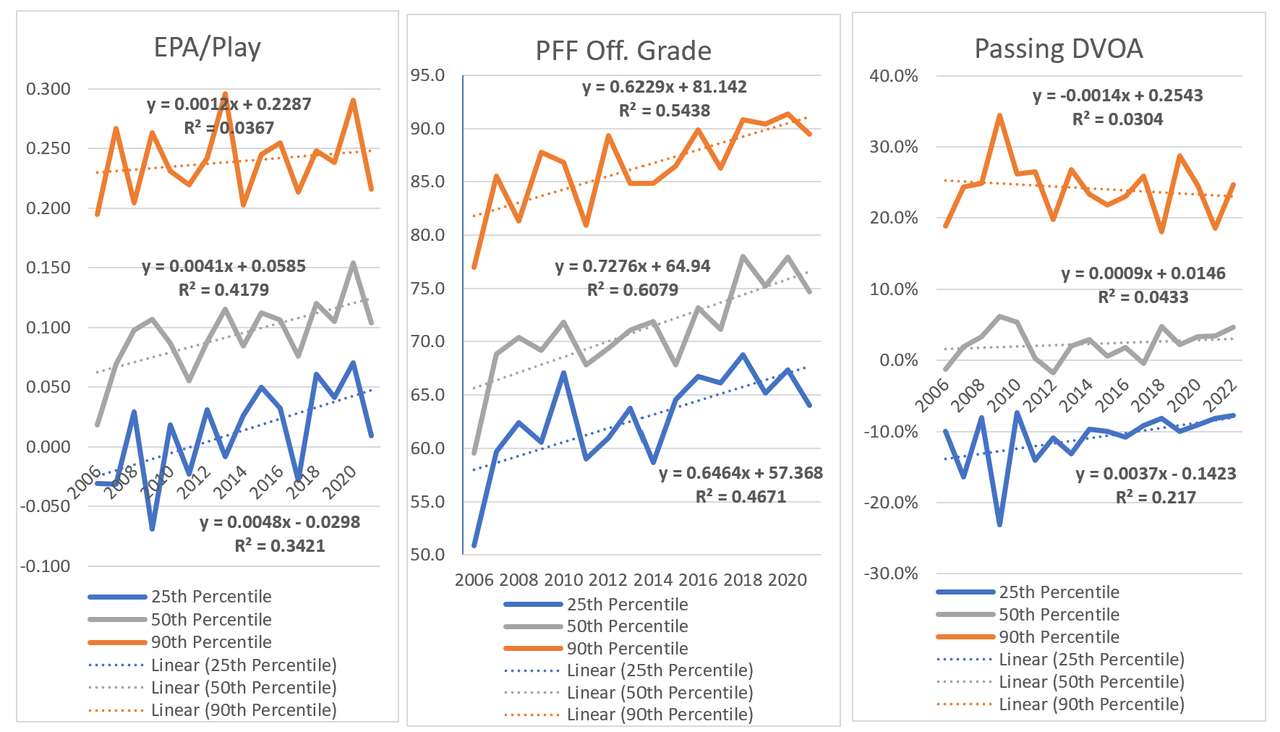
Both our EPA/Play and PFF Grade models show strong growth in the 50th and 25th percentiles. In our EPA/Play model, 90th percentile performance remains relatively flat with almost no correlation to the progression of time. Any rises and falls at the uppermost level of EPA/Play have little to do with the simple passage of time. However, our 50th and 25th percentile lines have much steeper slopes with moderately strong R²s. That decent correlation means that there is a bit of smoke here; we can assume that there is some correlation between lower-level quarterbacks improving over time.
Our PFF Grade model, on the other hand, shows strong upward growth and good correlation across the board. Our growth in the 50th and 25th percentile once again outpace our growth in the 90th percentile, but the steep positive slope of our 90th percentile quarterbacks cannot be ignored. Elite play at the quarterback position, at least on a play-grading basis, continues to rise at comparable rates to the growth we see from the 25th percentile.
It should be noted that we get across-the-board drop-off in 2022 in both the EPA/Play and PFF Grade models. This past season saw scoring down historic levels across the league. Underdog contributor Bryan Knowles diagnosed the problem midway through the season, citing a perfect storm of injuries, defensive adjustments, and quarterbacks changing teams leading to the drought. This may have impacted correlation in both models. It particularly had an impact on our EPA/Play model, considering the P in EPA/Play stands for “points.”
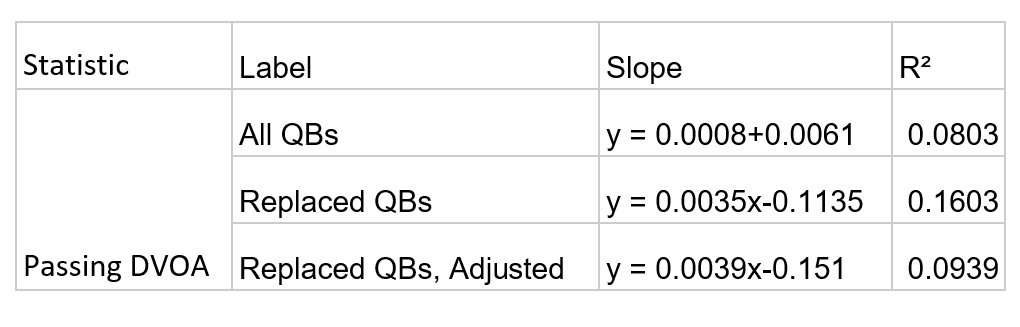
Our Passing DVOA model has by far the lowest correlation of our three statistics, which is to be expected. The number of controls and adjustments baked into DVOA, coupled with its focus on individual seasons, mean that the simple passage of time may not have the same correlation as it has with EPA/Play and PFF Grade. However, the DVOA graph gives us our most interesting output. The 90th percentile line trends downward at a rate of 0.14% per year, while the 25th percentile line trends upward at 0.37% per year. This narrowing in at the margins may suggest the spectrum of starting quarterback performance is shrinking, at least on a percentage basis. There is less separating the upper echelon of quarterback play from the bottom of the league. It is also fascinating to see, for a statistic with a built-in league average at 0.0%, just how high above zero our 50th percentile line finishes. That tracks in Football Outsiders’ data as well. In 2022, 34 quarterbacks qualified for FO’s quarterback DVOA ranking; 21 finished with a positive DVOA.
With all that considered, all of this upward growth is somewhat expected. The last 16 years of data is a snapshot of the 40 or so years dedicated to optimizing passing offenses and quarterback play. Credit Don Coryell, Bill Walsh, Mike Leach, and Chip Kelly for dragging this sport into the modern age. Blame league officials for rule changes making it harder to defend passing plays through pass interference and illegal contact. The result remains the same: quarterback productivity is going up over time.
Our goal is not about finding whether all quarterbacks are improving. The focus is instead on the quarterbacks teams are choosing to move on from.
Introducing Replaced Quarterbacks
With starting quarterbacks established, determining “replaced quarterbacks” is a simple exercise of figuring out whether the quarterback with the most starts in a given year was also the quarterback with the most starts the following year. That being said, not all quarterback substitutions are created equal. Some moves, like cutting a player from a roster or trading a quarterback away, are decisions completely within a team’s control. Others, like playing a backup when a starter gets hurt or looking for a quarterback after a starter retires, are typically out of a team’s control. Therefore, it is important to identify why a quarterback was replaced. Each replaced quarterback into one of the following categories, explaining what happened to the quarterback the following season:
Replacement, In-Season: At some point during the following season, the current starting quarterback was replaced but remained on the roster for the remainder of the regular season. This typically happens when rookie quarterbacks taken outside the first round of the draft challenge the incumbent for the starting job.
Replacement, Out-of-Season: During the offseason in-between that quarterback’s last starting season and the following season, the team acquired a quarterback (either via trade or through the draft) to replace their current one. This
Injured: A quarterback suffers a significant injury, either placing them on a season-ending injury reserve or sidelining them long enough to make a meaningful impact on the season
Injury Fill-In: A quarterback who only got the job because the team’s starting quarterback was injured. Injury Fill-In is always a one-year designation.
Released/Waived: The team cut the player from the roster, typically during the offseason. The difference between “Released” and “Waived” is determined by the player’s years of experience. Any player with four or more seasons in the NFL is released, immediately becoming an unrestricted free agent. Any player with less than four years’ experience is waived; other teams can claim them off a priority-based waiver wire before they become unrestricted free agents.
Opted Out: A quarterback with a player option in their contract elects to not pick it up, therefore leaving the team and becoming a free agent.
Traded Away: The team agreed to trade the player to another team. The
Free Agency: Once a player’s contract is up, they elected to sign with another team.
Retired: The quarterback retires.
Other: A category for quarterbacks whose absence the following year falls outside the structure of typical NFL transactions. This tag is only used twice in this database: for Michael Vick in 2006 and Deshaun Watson in 2020.
Of these categories, only four are outside the realm of control of a team’s coaching staff and front office: Injured, Injury Fill-In, Retired, and Other. Not only do these statistics represent scenarios where teams have no autonomy over the decision to change their starting quarterback, but they also happen independent of a player’s performance level. Any quarterback can suffer a season-ending injury or walk away from the game, while Injury Fill-Ins typically lose their job regardless of performance. Therefore, the ”replaced quarterbacks” label also has an “adjusted” subset, ruling out the labels that remove autonomy from the decision-making process.
Number of Starting Quarterbacks, 2006-2022, Who Were Replaced the Following Season
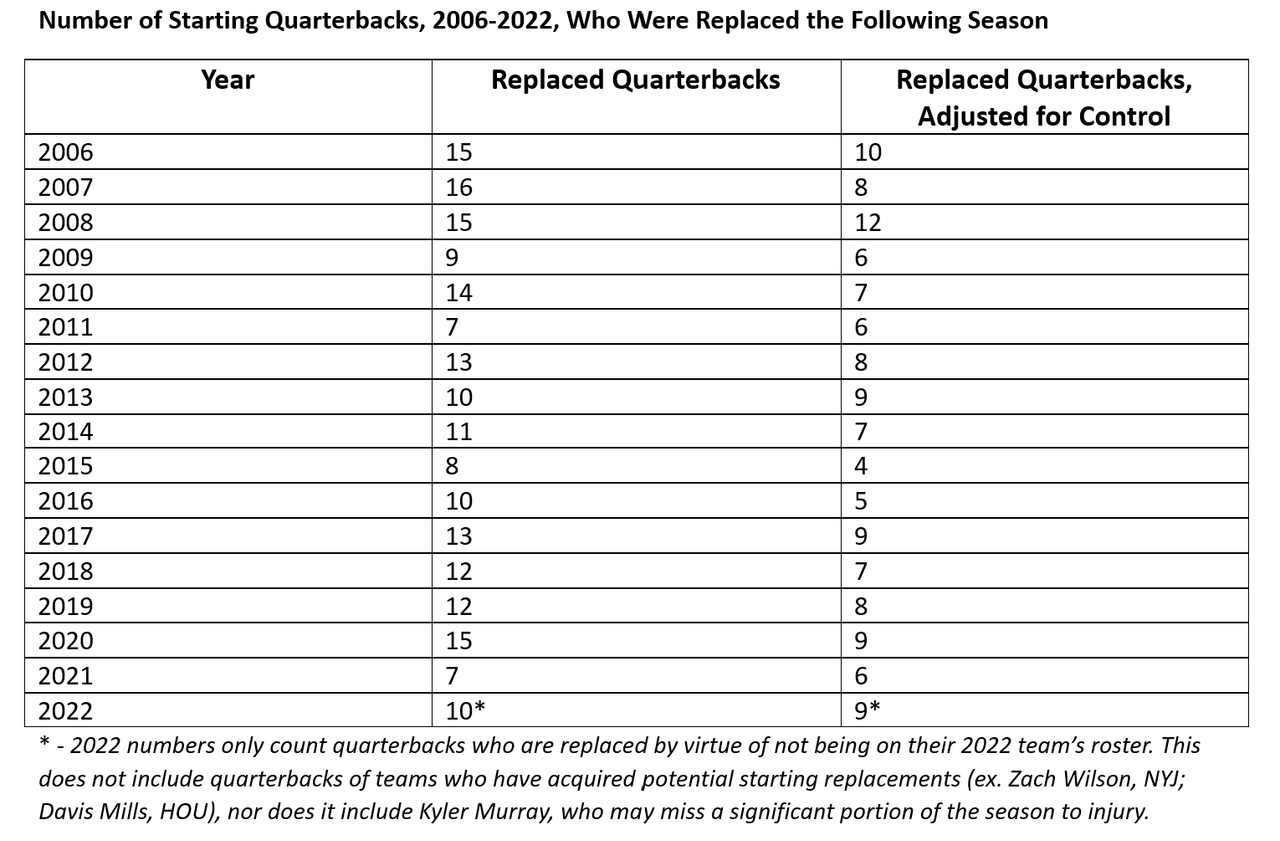
* - 2022 numbers only count quarterbacks who are replaced by virtue of not being on their 2022 team’s roster. This does not include quarterbacks of teams who have acquired potential starting replacements (ex. Zach Wilson, NYJ; Davis Mills, HOU), nor does it include Kyler Murray, who may miss a significant portion of the season to injury.
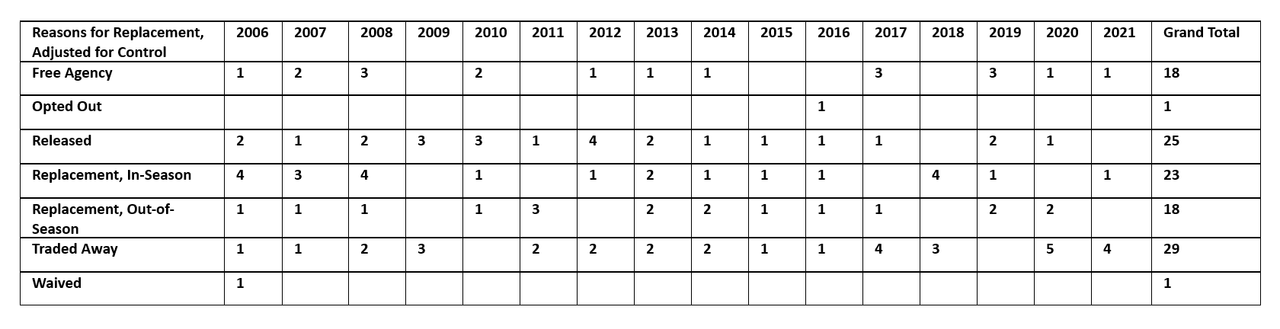
Weeding out quarterback replacements not left up to a team’s decision can help isolate how often teams are actually making the conscious choice to move on from quarterbacks. Under this control, we removed 66 quarterbacks from our dataset. The exercise of removing random injuries reveals that the rate of replacement stays pretty constant. There are outliers, of course. 2008 saw 12 quarterbacks get moved, headlined by Favre’s second move in two years and the Kyle Orton-Jay Cutler swap between the Denver Broncos and Chicago Bears. 2015 is our most stable season. Adjusting for control removes Peyton Manning’s retirement and combined season-ending injuries to Teddy Bridgewater, Jay Cutler, and Tony Romo, leaving us with just four one-off quarterbacks losing their jobs.
While the rate of quarterback replacement is mostly constant, the real movement lies in how team choose to move on from quarterbacks. 11 of 23 in-season replacements occurred in the first three years of our sample size. Starters like Buffalo’s J.P. Losman and Tennessee’s Vince Young suffered minor injuries the following season; their time on the sideline opened the door for backups to take over the reins, and coaches allowed those backups to take over for the rest of that season. Over the next 13 seasons, 2018 is the only other season with more than two in-season replacements. That year paved the way for Lamar Jackson, Daniel Jones, Gardner Minshew, and Ryan Tannehill to earn starting roles, three of which turned into multi-year opportunities.
On the other end, trades are a more popular modern method of getting rid of quarterbacks. More than half of all quarterback trades in the dataset occurred between 2017-2018 season and the 2021-2022 season. Part of that has to do with player empowerment, a subject more thoroughly touched on later in the piece. However, a good deal of that has to do with a better understanding of draft capital. There are seldom wasted assets in the modern NFL. It is rare to just let a starting-caliber quarterback walk without getting some asset back in return. As shown by the 2022 San Francisco 49ers, even the last-overall pick can yield a meaningful asset at quarterback.
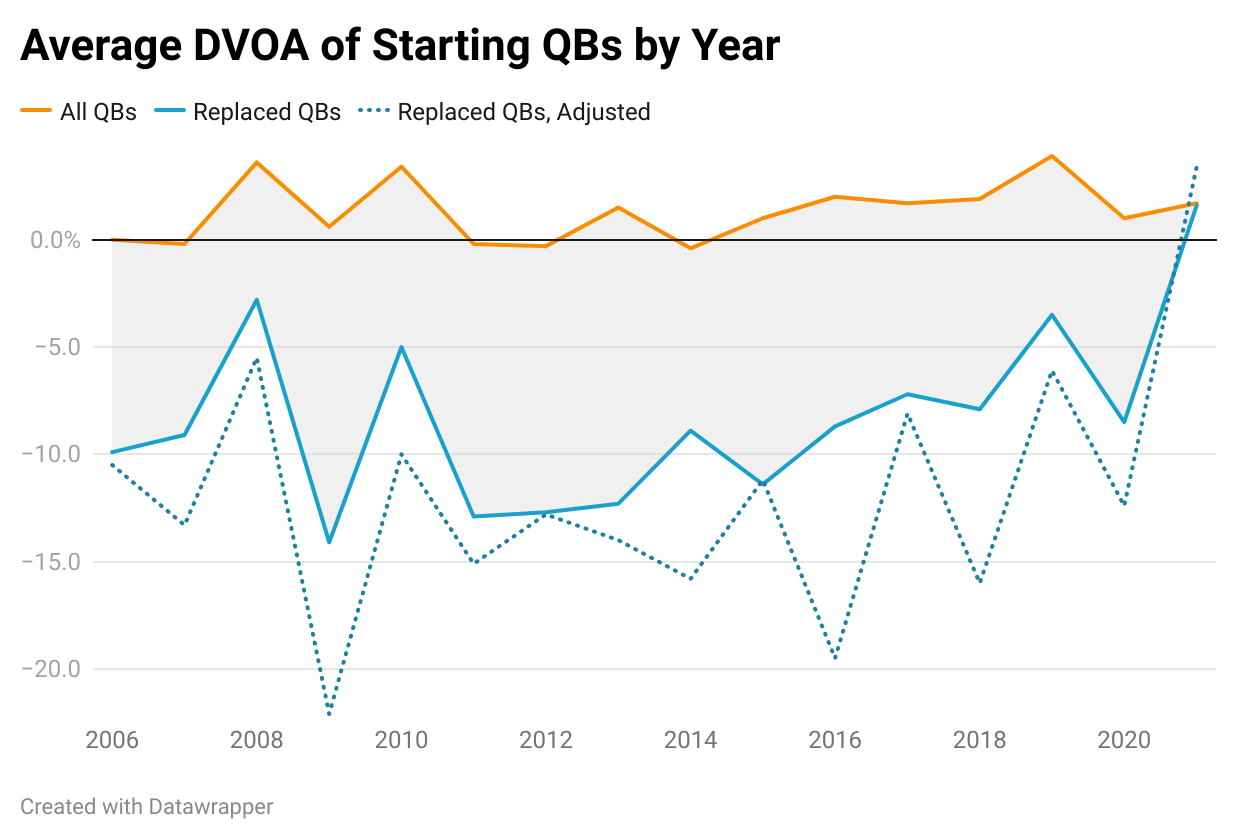
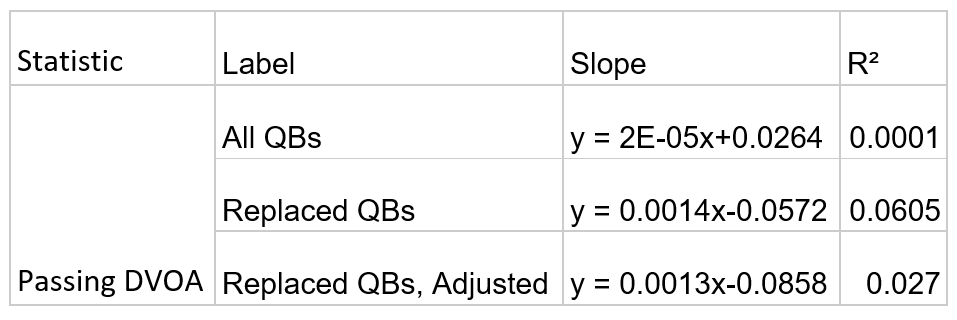
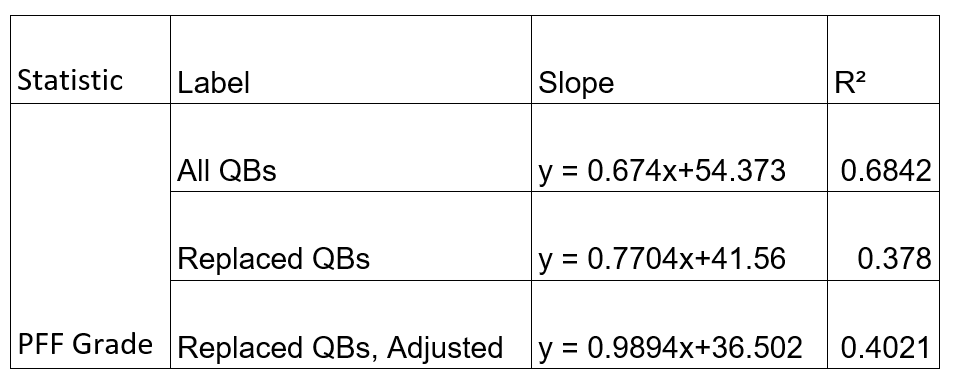
Average By Year, With and Without Snap Count Weight.
To determine the performance of replaced quarterbacks relative to the rest of the league, we will take the average of each statistic per season, broken down into “All Quarterbacks,” “Replaced Quarterbacks,” and “Replaced Quarterbacks, Adjusted” [also referred to as “Adjusted Replacements”]. While this crushes data into a singular datapoint and drives our sample size down, it heavily reduces the noise created by placing them all in a scatter plot.
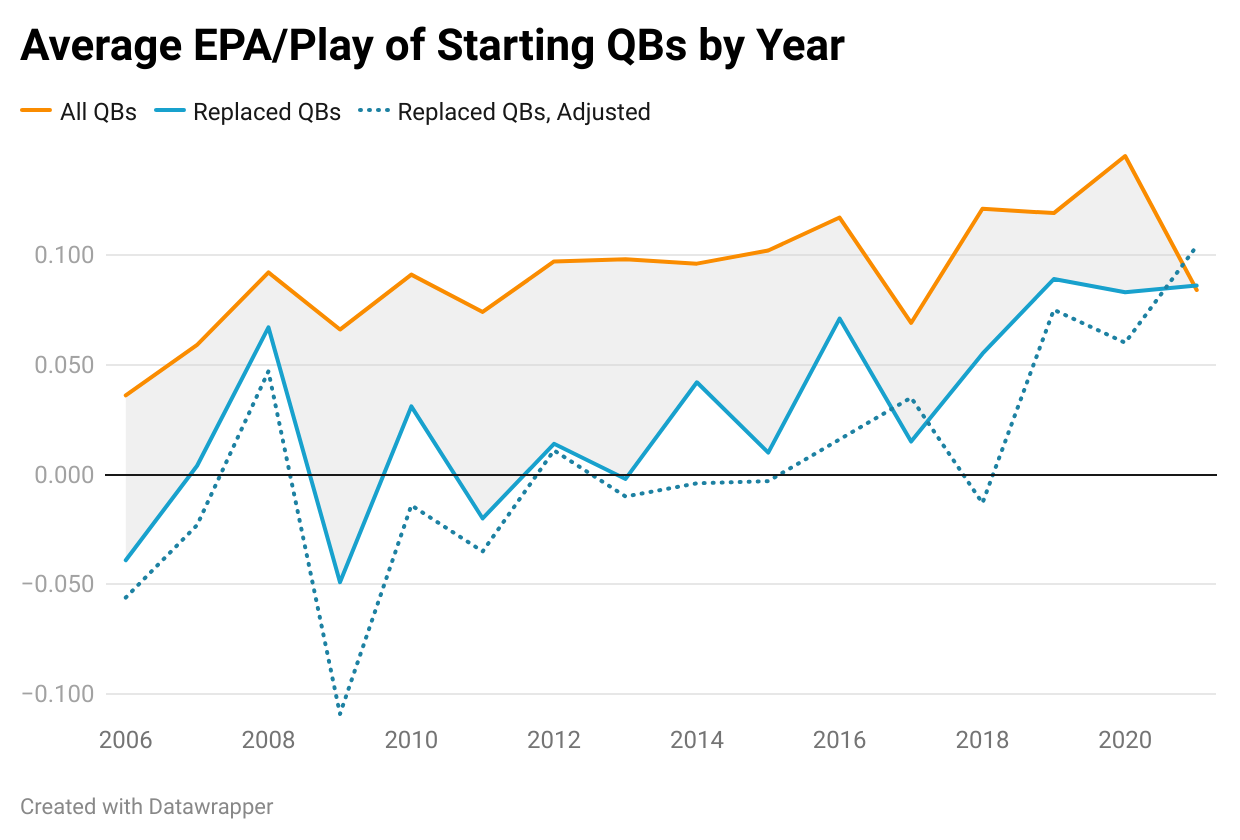
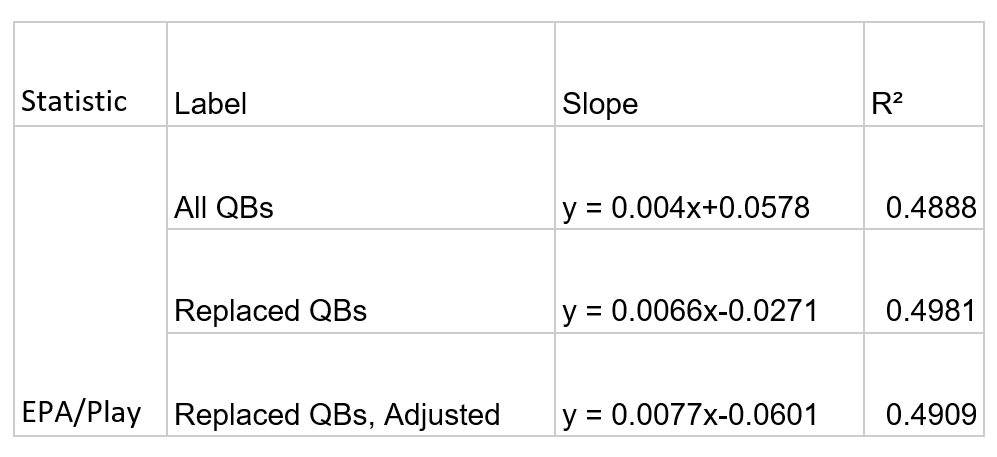
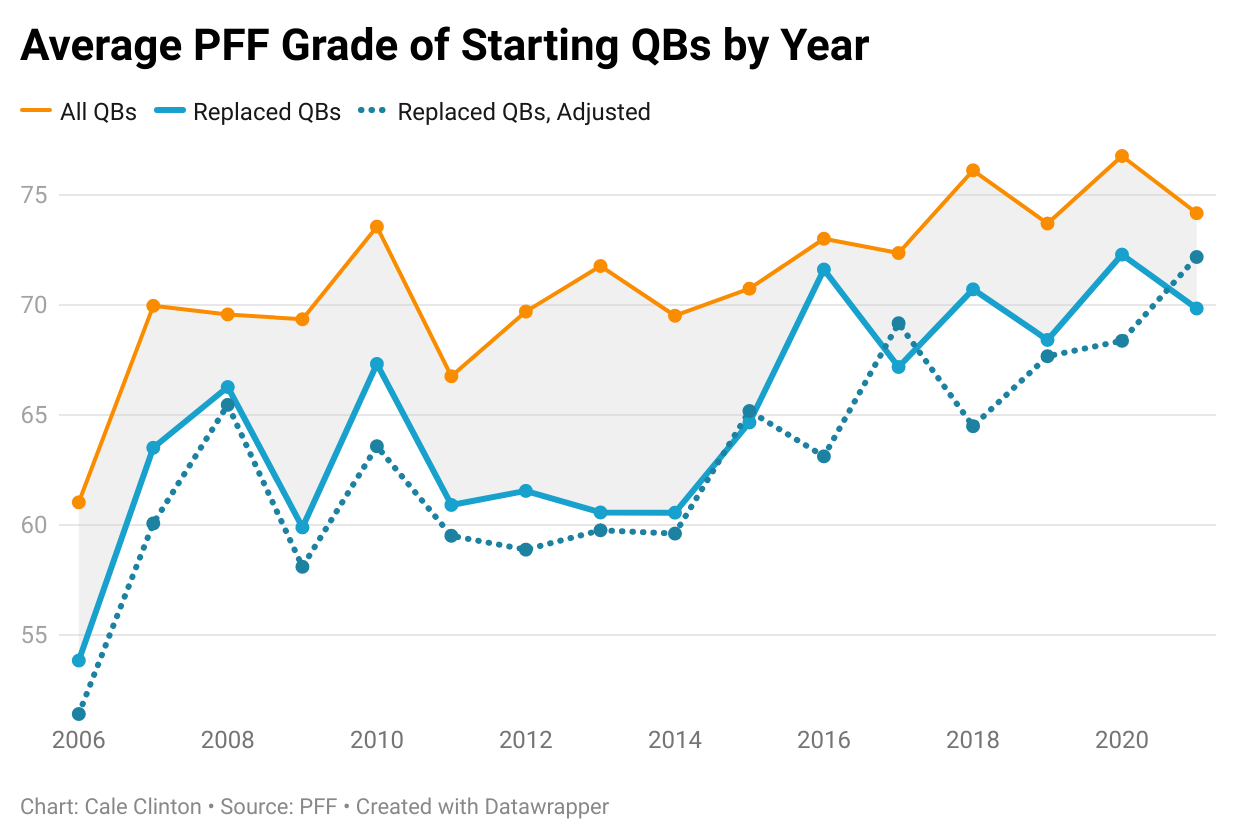
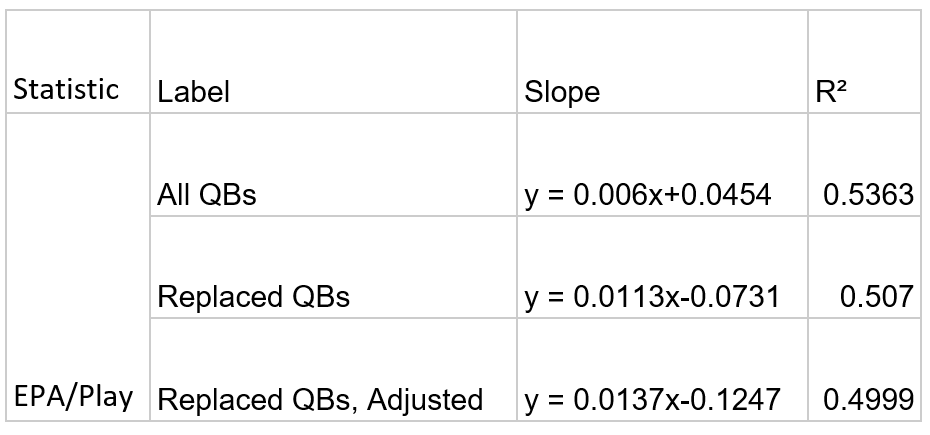
In all three cases, the Replaced QBs and Adjusted Replacements have upward-trending slopes that outpace the growth of All QBs and solid correlation across both EPA/Play and PFF Grade charts. The correlation across the board on both charts is extremely encouraging. These R²s that hover around 0.5 tell us that there are definitely some other variables playing a part in this outcome. With 22 players on the field at a given time across 32 teams, one would hope to have some noise in their data. This solid of a correlation, though, tells us that time accounts for a meaningful amount of this progression. Replaced quarterbacks are getting better over time, and they are improving faster than the rate all quarterbacks are improving at.
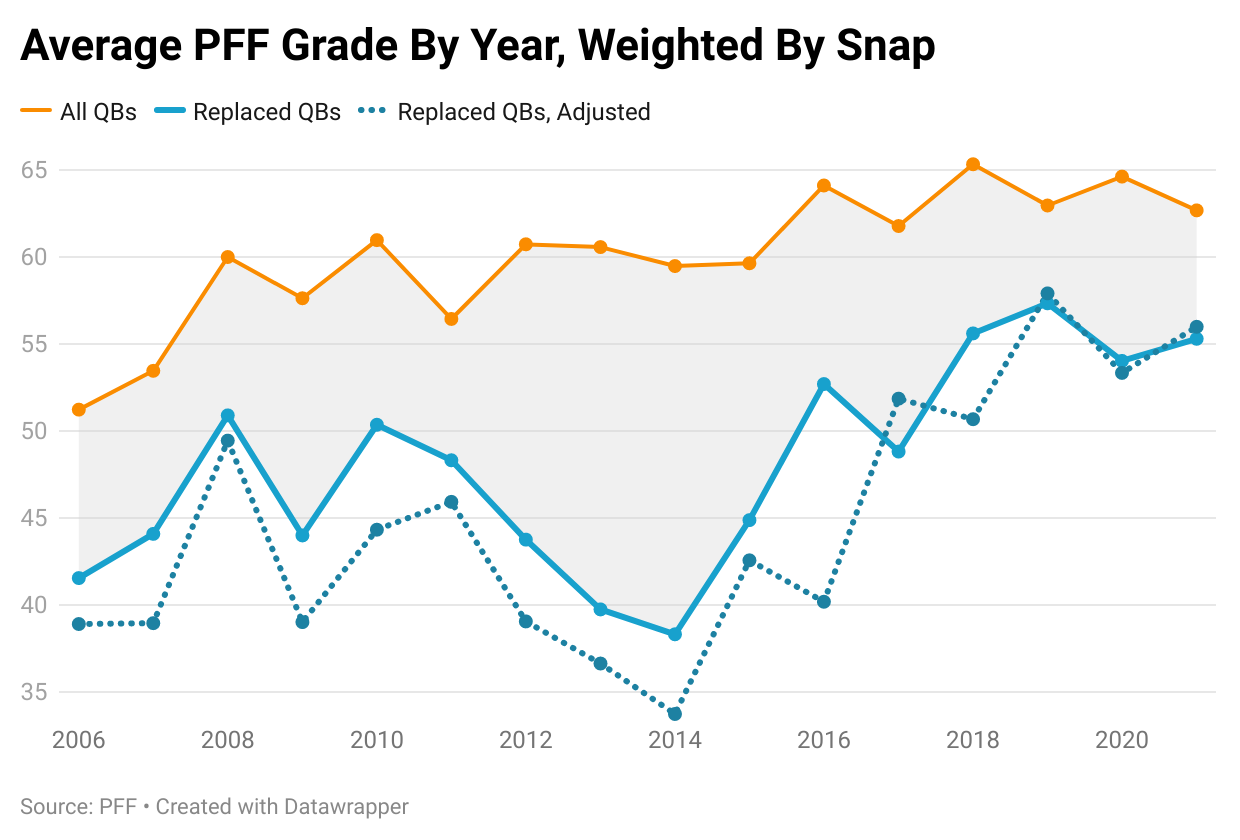
Not only can you see that in trendline slopes, but you can actually see Replaced QBs close the gap with All QBs between 2006 and 2021. Both EPA/Play and PFF Grade models feature a visibly narrowing gap between All QBs and Replaced QBs, highlighted in grey. In the first four years of the EPA/Play chart, the two lines and the average a 0.0675 gap between them. Through the first four years, both lines get down to an average separation of 0.039. The PFF Grade Chart shows a similar trend: the first four years average 6.6 in distance while the final four years average a gap of 4.88.
The Passing DVOA chart is once again a very low-correlation graph. They also pass the pace test. The last four once again outpace the first four, moving from 9.98% to 6.70%.
The Adjusted Replacements line, in a dotted dark blue, is decidedly lower than Replaced QBs, as is to be expected. The gap still narrows across the board: from 13.85% to 9.90% for DVOA, 8.72 to 7.01 for PFF Grade, and 0.099 to 0.061 for EPA/Play. That 2021 season certainly helps raise the average through the final four years. Adjusted Replacements leapfrogs Replacement QBs on all three graphs and even manages to eclipse All QBs in DVOA and EPA/Play.
It’s the reason why our next step will be to add a snap weight. In 2021, RBSDM listed Aaron Rodgers and Jameis Winston as the top-two players in EPA/Play, minimum 200 plays. Rodgers (0.265) recorded 609 plays in 2021, while Jameis Winston (0.252) recorded just 204. Jameis also finished with a 13.6% DVOA; four of the six quarterbacks under Adjusted Replacements finished with a positive DVOA.
Using games played as our method to determine starting quarterbacks is fine, but there needs to be a way to eliminate small sample size over-performers. A high DVOA season over 1,100 snaps should not be equal in value to a high DVOA season over 700 snaps. These next graph use the same format, but each player’s stats are multiplied by their offensive snap rate (percentage of offensive snaps taken relative to the team’s total offensive snaps).
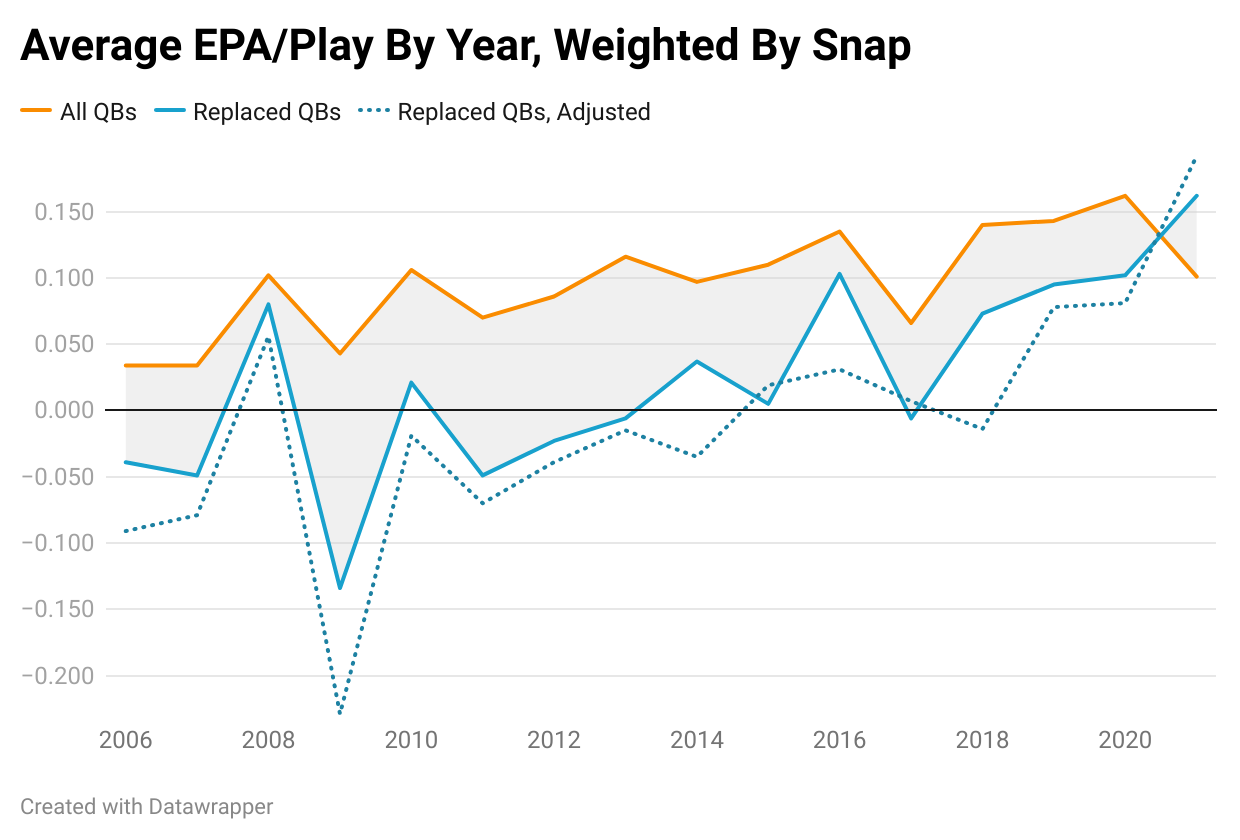
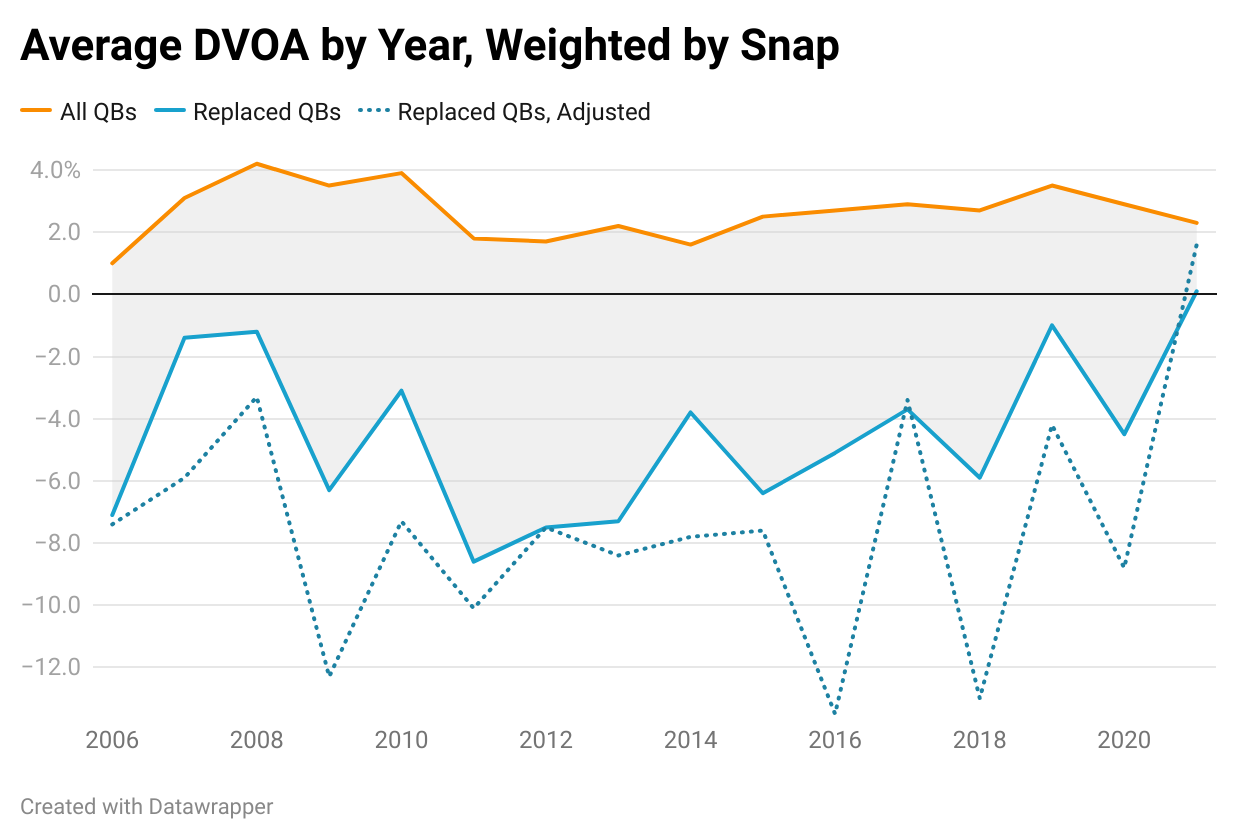
What was already a low-correlation Passing DVOA chart has become even less correlated with a near-zero R² among All QBs. There is little we can really gather there. PFF Grade reestablishes a wider gap between All QBs and the rest of the pack. Even with that shown, both Replaced QBs and Adjusted Replacements still close the gap on All QBs. EPA/Play is the graph that best makes the case for us that standards have gotten higher. The gap between All QBs and the field shrinks even more. The first four/last four averages, especially for Adjusted Replacements, closes the gap even faster than without snap adjustments.
With decent correlation across both EPA/Play and PFF, we have some certainty that production is improving at a rate among both Replaced QBs and Adjusted Replacements that outpaces the growth of all starting quarterbacks. While PFF Grade still features a big gap between All QBs and Replaced QBs, EPA/Play has considerably narrowed that gap, even when snap-weighted.
This is important. Even when accounting for smaller sample sizes, the quarterbacks worthy of being replaced are improving faster than the league-wide rate of improvement. The standard for starting-level play is changing, and it is changing rapidly. Most of this growth has taken place in 2018 and beyond.
What does it correlate to? Some can be pinned on player autonomy in the process. Brady and Rivers jumpstarted the movement of high-end veteran talent movement, believing they could extend their careers despite their age. Rivers went to the Colts and led them to the playoffs. Brady won his seventh Super Bowl in his first year in Tampa Bay. That inspired others to find new teams. Stafford leaves for the Rams and wins his first title on a loaded roster. Russell Wilson asks out and lands in Denver. Aaron Rodgers will try to do the same as a member of the Jets.
Now, in addition to cast-off quarterbacks, grouping by year includes high-quality starters. Over the last four seasons, premier level talent has decided that they don’t need the right situation built around them; they can simply join the right situation.
One thing all these quarterbacks had in common: all were well into their 30s (Brady in his 40s) with realistic aspirations of winning a Super Bowl. These were older quarterbacks playing at a high level later in their career. Most of their predecessors didn’t play at that level this late into their career. All these quarterbacks being worth the contracts pitched or the trade capital offered at their age is a bit of a historic anomaly. That creates a logjam of talent on its own. Older players playing above-average for longer leaves fewer jobs for young quarterbacks.
Not only was old talent sticking around longer, but young talent was better and more abundant than ever. Patrick Mahomes played his first full season as a starter in 2018. Lamar Jackson, Joe Burrow, and Justin Herbert got their first full seasons that next year. The year after that was when Josh Allen took his fabled Year 3 Leap. Jalen Hurts and Trevor Lawrence both became full-time starters the following season. In four years, the wave of young, elite talent on cheap deals upended the league.
The old guard was still good enough to compete and contend on the right roster. In a vacuum, though, they weren’t better than what was entering the league. Player autonomy only goes so far. These players are still under contracts. The fact that their original team was even willing to move on from them screams that these are quarterbacks a tier below this elite young class. For most teams, the rookie wage scale makes it more lucrative to pan through draft picks looking for gold than it would be to pay a veteran quarterback market rate to try and compete. Without an already-stacked roster that is a veteran quarterback away, most franchises’ best shot at competing with this youth movement is by finding an elite youngster of their own.
This just shows you how drastically standards can change. There are ways to win in the NFL with a great roster and sub-elite quarterback play. The 2017 Eagles posted the best offensive production in Super Bowl history with a backup. The 2019 49ers nearly won with a good-not-great quarterback in Jimmy Garoppolo. It is possible, yes. Having one of these quarterback makes it so much easier, though.
When a quarterback like Patrick Mahomes raises the bar, it sets a new standard of play. The rest of the league gets into an arms race trying to keep up. All of a sudden, the Jimmy Garoppolos and Derek Carrs of the world are expendable to the point they hit the open market, or get outright sent there via release. A quarterback that cannot keep up ends up left behind.
More About Replaced Quarterbacks
With a definitive understanding that teams are moving on from better quarterbacks, we can assume that teams move on from a quarterback that can still perform at the NFL level. In fact, there are times where a replaced quarterback loses their job, lands with a new team as starter, and plays better than he did with his old team. How often do teams actually make the right call? When teams get ready to move on, how often is the new guy actually better?
Of the 137 quarterbacks in the sample size, 38 of them are career one-and-dones as starters. Even when accounting for the seasons played by veteran quarterbacks prior to our sample size, each one qualified as a season-long starter just once in their career. These are your Tim Tebows, Brady Quinns, and Dan Orlovskys of the world. One-and-done quarterbacks are typically younger quarterbacks who get thrust into a starting role under bad circumstances; they never get the chance to be a real starter beyond that lone year.
An additional 11 quarterbacks were labeled “long runway” one-and-dones: quarterbacks who saw between two and five years as a starting quarterback for one franchise, then never starting again. Think of Blake Bortles, who started 61 games his first four years with the Jaguars, then lost his job midway through the 2018 season and transitioned to a backup role. This label is assigned with some level of discretion, however. If we did this project last year, 2022 Comeback Player of the Year Geno Smith would have received the “long runway” label. That performance alone, rare as it is, opens up a lot of possibilities for potentially rescinding some of these labels later.
In total, 49 of the 137 quarterbacks were replaced and never started for a meaningful amount of time ever again. More than a third of all starting quarterbacks do not make it past their first team.
There were 37 individual instances where a quarterback started the season immediately after being let go by another team. Whatever the reason for the dismissal, each of these quarterbacks were still considered viable NFL starters.
NFL Quarterbacks in their first season as started after Replacement, 2007-2022
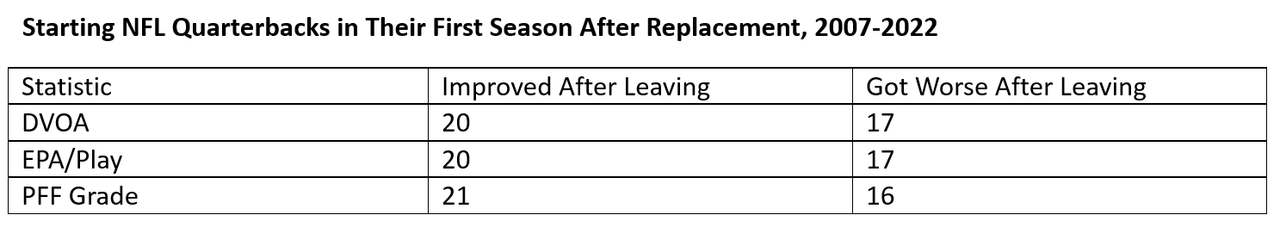
In those 37 instances, 22 saw replaced quarterbacks improve in at least two categories with a new team and 14 improved in all three. On the flipside, an additional 13 instances saw quarterbacks get worse in all three categories when playing with new teams.
Some entries prove that this exercise isn’t entirely controlled by quarterbacks. Teams absolutely come into play. Take Brett Favre. He left the Packers in 2007 performing relatively well across the board to go to the New York Jets via trade. 2008 was the worst year of Favre’s career on the field, and sexual misconduct off the field forced the Jets to cut Favre at the end of the season. Minnesota picked him up shortly thereafter, and in 2009 Favre posted career highs in DVOA and EPA/Play.
The fate of the deal extends beyond the first year of the deal, too. Take Jared Goff’s move from the Los Angeles Rams to the Detroit Lions. Goff is one of the 14 examples of a quarterback declining across the board after moving teams, but his second season with the Lions is arguably one of the best of his career. In 2022, Goff posted a career-high 24.8% DVOA along with a second-highest 0.171 EPA/Play and 72.4 PFF Grade.
The same principle can be applied to opting for rookie talent over a veteran starter. In 121 instances of a quarterback replacement, 59 resulted in starting a quarterback on their rookie contract. 44 of those 59 happen from 2011 onward, after the implementation of the rookie wage scale. Young quarterbacks are held to a lesser standard than veterans on second or third contracts, so under-performing the quarterback who just left town can be tolerated to an extent. Plus, the low fixed cost of rookie quarterback contracts compared to the rest of the market offer teams cap incentives to try and get a younger quarterback.
At the end of the day, though, the main goal of every NFL team is to improve. Quarterbacks take time to adjust to new teams, and rookie quarterbacks take time to develop. But a team chooses to change starting quarterbacks when they believe that change will make their team better overall. How often are those teams immediately justified in their decision? More specifically, how often do teams replace a starting-caliber quarterback and improve?
There are 29 head-to-head matchups we can find that compare a replaced quarterback starting elsewhere with the quarterback who replaced them. This number comes in lower than our original total of 37 starting-caliber replacements after adjusting for injury fill-ins (ex. Matt Cassell starting for the 2009 Kansas City Chiefs after replacing Tom Brady during his ACL season) and retirees (ex. Carson Palmer retiring to force his way out of Cincinnati). This number also filters out trades swapping quarterbacks, like the one swapping Matthew Stafford and Jared Goff. Determining which team “won” the trade is a different exercise than the one we are currently focusing on.
Replaced Quarterback vs Team’s Replacement, 2007-2022
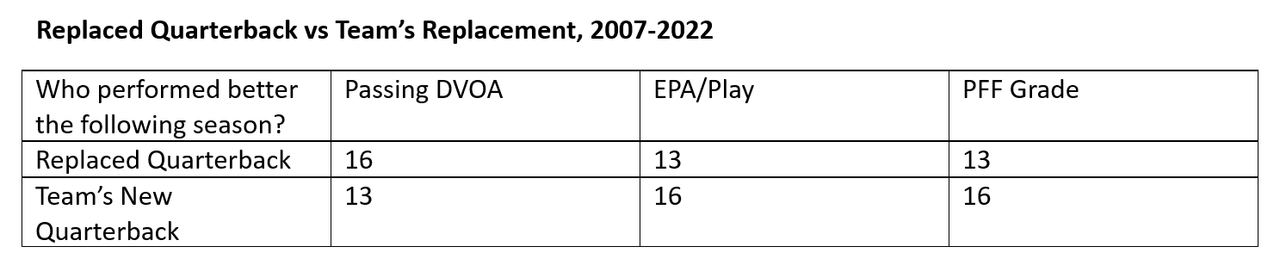
Even when you consider that most of these quarterbacks are improving their production when switching to a new team, front offices are still making the right call more than half the time. There are 11 instances where the team’s new choice at quarterback performed better than the replaced quarterback in all three statistics. The replacement wins across the board in eight.
EPA/Play and PFF Grade are once again in lock-step. Passing DVOA, our outlier statistic throughout portions of this exercise, actually has the roles flipped. Replaced quarterbacks out-perform the team’s replacement at about the same rate, just reversed.
There is only one time where both EPA/Play and PFF Grade disagreed with DVOA: in 2021, when the Philadelphia Eagles replaced Carson Wentz with Jalen Hurts. Hurts was a weak passer with a very poor receiving corps around him; a stat solely focused on passing would not favor the run-heavy quarterback in his first season starting. However, that is really the only time the “passing” part of Passing DVOA has resulted in an outlier piece of data. In all other instances where replaced quarterbacks win out, at least one other statistic agrees.
When we look at 2018 onward, numbers skew further in the teams’ favor:
Replaced Quarterback vs Team’s Replacement, 2018-2022
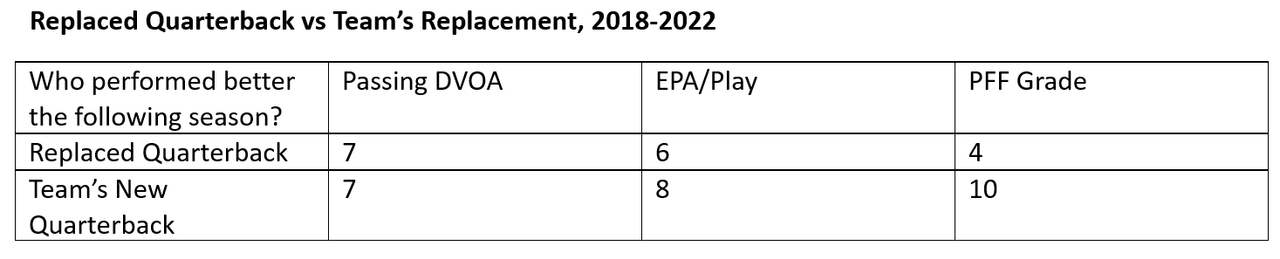
DVOA becomes a 50/50 split, and PFF Grade sides with teams in more than two-thirds of all cases. EPA/Play actually reflects rates near identical to the larger sample size. Of those 11 instances of a team sweep across all three stats, six of those occurred since 2018. Not only are teams getting it right more often, they have won convincingly in the last five years twice as often as the rest of the sample size.
There are only three instances since 2018 where the quarterback being replaced outperforms the team’s replacement: Ryan Tannehill moving from the Dolphins to the Titans in 2019, Tom Brady from the Patriots to the Buccaneers in 2020, and Teddy Bridgewater moving from the Panthers to the Buccaneers in 2021. That probably says more about the teams they are leaving than the quarterbacks themselves. However, that does a disservice to how these quarterbacks performed. Tannehill has seen a career resurgence since joining the Titans: his three best seasons by DVOA, EPA/Play, and PFF Grade have all come with Tennessee. Brady saw massive production leaps across the board well into his 40s. Bridgewater had the best year of his career as a starter by DVOA and EPA/Play in Carolina, then set new career-highs in both when going to Denver. Those numbers look even better when compared to his eventual replacement in Russell Wilson.
14 of these 29 head-to-heads involve replacing a quarterback with one on a rookie contract. In those matchups, the rookie was the better choice in eight of those cases. Since 2018, though, five of seven pairings involving rookie replacements end in the team’s favor. The lone two failures are Zach Wilson replacing Sam Darnold, and Sam Darnold (still on his rookie contract) replacing Teddy Bridgewater.
These victories for rookies are striking. Quarterbacks like Andy Dalton, Philip Rivers, and Carson Wentz all improved their production after leaving their respective teams. Even Alex Smith, whose EPA/Play, DVOA, and PFF Grade all fell after leaving Kansas City in 2017, still produced a positive EPA/Play and a starting-caliber PFF Grade. The rookies replacing these quarterbacks were just that much better.
Conclusion
Through this exercise, we have established the following: First, production from quarterbacks has improved across the board. Second, the growth in production from quarterbacks who get replaced outpaces the league-wide growth we have established. Third, even when teams choose to move on from quarterbacks, they are making the correct decision more often than not.
The standards for quarterback play have undeniably risen across the league. While there are still teams making poor quarterback decisions, and there is still a sizable gap between the average starting quarterback and the average replaced quarterback. However, we are now seeing capable, high-performing quarterbacks get moved by teams hoping to find something even better.
This could be one of the first signs that the league is in need of expansion. That is a much larger conversation with variables that extend well beyond the quarterback position, but we have reached a point where there are more playable quarterbacks than there are teams in the league. Even within a statistic like DVOA that boasts a built-in league average, more than half of qualifying quarterbacks are finishing with positive passing DVOAs. Median DVOA finishes above 0%, while 25th percentile EPA/Play easily finishes in the positive. In a quarterback market that consistently sees anywhere from 20 to 30 percent of starters consciously replaced, those starters can still be positive contributors to another team. It’s how the 2022 DVOA leader Jimmy Garoppolo and 4,000-yard-per-year quarterback Derek Carr both hit free agency.
These are just three of the dozens of variables that go into quarterback play, let alone offensive performance or overall team construction. There is no variable to calculate improvements in NFL teams’ data collection to weed out potential draft busts, breakthroughs in quarterback development, or changes in NFL scheme to make the quarterback role easier. However, from the information available, we have some confidence in saying that what is considered a good starting quarterback is changing and changing fast. As time goes on, better and better quarterback talent is being passed on for the chance at something even greater.