Best Ball Fantasy Football Analytics
Earlier this week, we released the pick-by-pick data from last year’s Best Ball Mania I to the public. That means I’m stuck in my mom’s basement this week to bring you guys some takeaways from the raw dataset. In this column, I do just that. Here are my 5 translatable insights from last year’s best ball tournament.
But first, here’s a link to sign up to play on Underdog Fantasy — home of the $3.5M Best Ball Mania II tournament. All first time depositors will get an additional $10 by using this link. That means you get a FREE ticket into BBMII. Since you’re reading this BBMI recap column already, you should probably get into this year’s version now:
How Did Each Position Do at ADP?
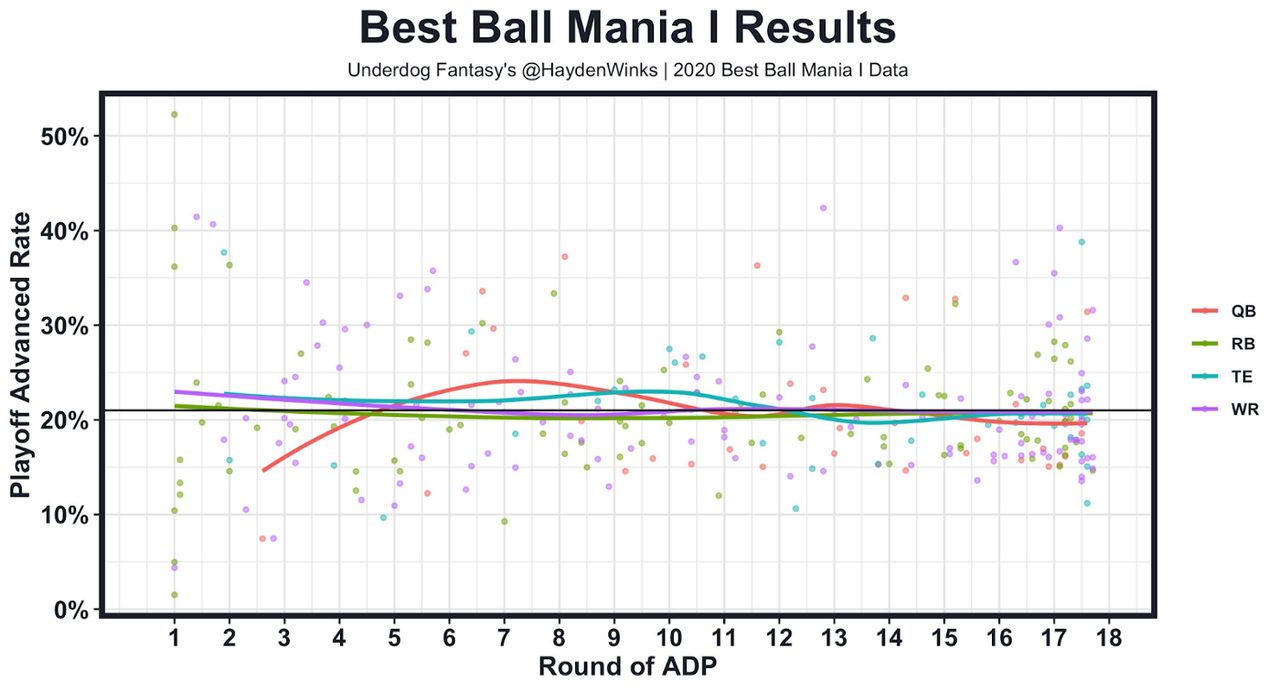
This chart uses the playoff advanced data that I dropped here. It shows how often a player advanced to the best ball playoffs last year, and where they were drafted on average. To be honest, this chart is pretty cool looking, but it’s largely unhelpful when it comes to identifying trends. Advanced playoff rates for all positions are mostly flat throughout with the exception of early-round QB. More on that at the end of this column…
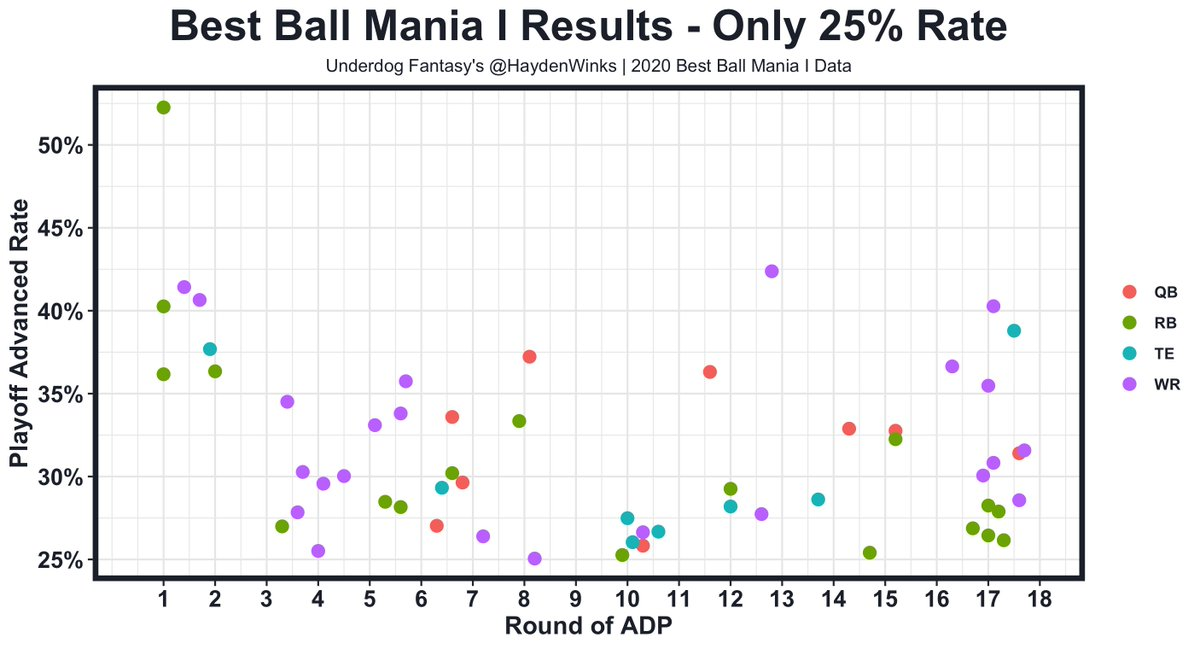
This chart is the same as above, but I removed all of the players with average or below-average win rates, leaving us with just the players who moved the needle in terms of win rate last year. This can be very noisy because it’s just one year of data, but this chart is more evidence that The Golden Rule of Best Ball works.
Yes, RBs in the first round like Saquon Barkley and Christian McCaffrey had some of the worst advanced playoff rates last year, but nobody has the toe-curling upside of the early-round RBs. Last year, teams with Dalvin Cook advanced to the best ball playoffs at a league-high 52% clip, and all of 4 the RBs with a 35% advanced rate last year were drafted in the first two rounds. That’s why I favor “Hero RB” or “Bimodal RB” in general.
As we move along to Rounds 3–6, you’ll see an influx of purple dots, also known as WRs. If you aren’t loading up on WRs in this range, you’re missing out on the upside WR2/3s that have historically been profitable. This is why I try to leave Round 7 with at least 4 WRs — that’s The Golden Rule of Best Ball.
Rounds 6–15 are where QBs and TEs had “breakout” seasons. Some examples included Aaron Rodgers, Ryan Tannehill, Kirk Cousins, Rob Gronkowski, Mike Gesicki, and T.J. Hockenson. This list is a reminder that beating ADP by 5–10 spots at the position is all it takes to be really profitable. A 99th percentile outcome isn’t needed.
Rounds 16–18 were filled with breakout players like Corey Davis, Chase Claypool, Cole Beasley, Marquez Valdes-Scantling, Tee Higgins, and Giovani Bernard. All of these players had projected roles in decent offenses but were slipping for various reasons. If you wander too far off the broken path in Rounds 15–18, you’re likely galaxy-braining yourself into a -EV selection. Just take the WRs who will be on the field.
Which Positions Have Positive Correlations with Each Other?
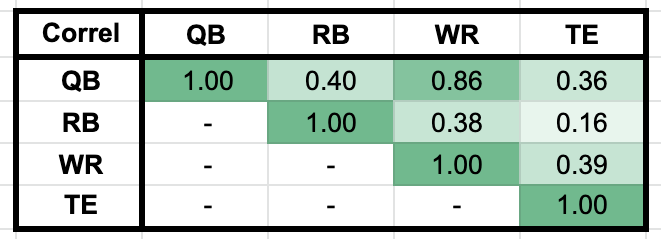
This correlation matrix shows how strong the relationship between each position’s playoff advanced rate is for players on the same team. In other words, how tied a team’s WRs are with their team’s RBs.
What last year’s data shows is no surprise. The tightest relationship between positions on the same team, by far, was between QBs and WRs (at +0.86 correlation). If a WR has a breakout season, he carries his QB to an above-average season and vice versa. The best way to use this information is to stack in best ball. I hope this isn’t breaking news.
The other relationships between positions are still positive, but they are noticeably weaker. A QB and his team’s RBs had a correlation of +0.40 last year. A QB and his team’s TEs had a correlation of +0.36. This means that we can stack a QB with his RBs and/or TEs, but it’s not working nearly as well as it is with WRs.
Are We Undervaluing Matchups in the Semifinals When Building Stacks?
This is the list of the top 20 players who appeared on a finals roster in Best Ball Mania I.
Derrick Henry
Josh Allen
Stefon Diggs
David Montgomery
Calvin Ridley
Ryan Tannehill
Tony Pollard
Travis Kelce
A.J. Brown
Corey Davis
Justin Jefferson
John Brown
Tyreek Hill
Dalvin Cook
Baker Mayfield
Michael Pittman
Melvin Gordon
Robby Anderson
Allen Robinson
Brandon Aiyuk
Studying the individual players here is a waste of time in my opinion, but it’s worth noting that 14 of the 20 players played against each other in Week 15 last year: Lions vs. Titans (4), Bills vs. Broncos (4), Bears vs. Vikings (4), Cowboys vs. 49ers (2). And that doesn’t include teammates Tyreek Hill and Travis Kelce.
We spend some time analyzing teams facing each other in the best ball finals, but the only teams who make the finals are teams that had a massive performance in the week before. Because of this, it’s a highly concentrated player pool in the finals, so finals matchups are likely overrated.
Instead, it’s the two games before the finals that are worth stacking.
Take the Titans as an example last year. They took off against the Jaguars in Week 14 before shredding the Lions in Week 15. Those two massive games against those cupcakes are why Derrick Henry was on (literally) 50% of the rosters of best ball teams in the finals. It’s not because Henry had a favorable matchup in Week 16.
If you’re looking for a one-sheeter on everything about the fantasy playoffs this year, I have you covered here.
Do Teams Drafted In September Do Better Than Teams Drafted in July?
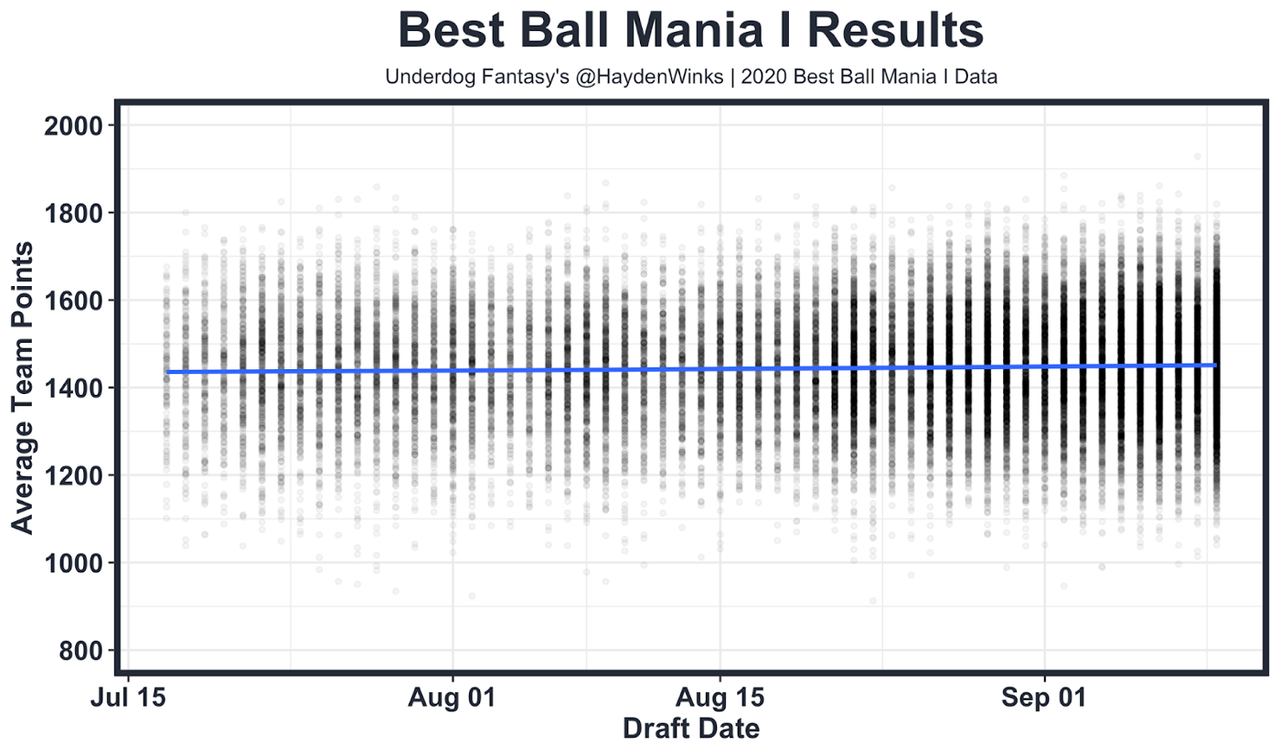
The big takeaway here is that you weren’t at much of a disadvantage drafting early in Best Ball Mania I last year. Best ball teams drafted in July averaged (only) 5–10 fewer points than teams who drafted in late August or September. The average points scored in the best ball regular season (Weeks 1–13) was between 1,440–1,460 points regardless of when the team was drafted.
It still may be smart to spread your exposure across the entire offseason, but not playing until right before the season isn’t giving you the massive advantage that you think it is. Well, at least that’s what last year’s data said. Perhaps 2020 was skewed by not having the normal training camp, which likely led to fewer pre-Week 1 injuries. It’s hard to tell.
Early-Round QB
Patrick Mahomes finished as the QB1 overall in fantasy points per game last year. He had 40 total touchdowns and averaged 316 passing yards per game. Despite another elite box score season, his advanced playoff rate sat at just 22%, which is exactly average. That was purely because of his average draft position. It is nearly impossible for QBs to have a high win rate when their Round ADP sits anywhere near Mahomes’ 2.8 from last year. We’re better off betting on Mahomes to win the MVP than draft him at cost in best ball.