Weekly Variance By Position - A Key To Best Ball
Best ball is a season-long game consisting of weekly scoring, so weekly variance is vastly important, yet doesn’t get that much pub in the content industry. That's probably because stats are for the damn nerds and player takes are more fun.
Today, I’m analyzing which positions have the most week-to-week scoring variance to better understand how many players we should be drafting at each position in best ball. The theory is that we need more players at positions with more variance, so we can ping pong their good games and increase our weekly ceilings with most of the money getting paid out to elite Week 17 scores.
This column isn’t going to account for bust rates, injuries, or anything else that we do need to be considering. Instead, this analysis is strictly looking at the best performers each season after the season played out, not the top-ranked players in ADP before the season. That’s fine because we are studying how scoring happens weekly in the NFL, not looking at the odds of CMC blowing out his hamstring this year.
Ultimately, this analysis will help with the “when we’re right, let’s maximize our team” concept.
Weekly Variance

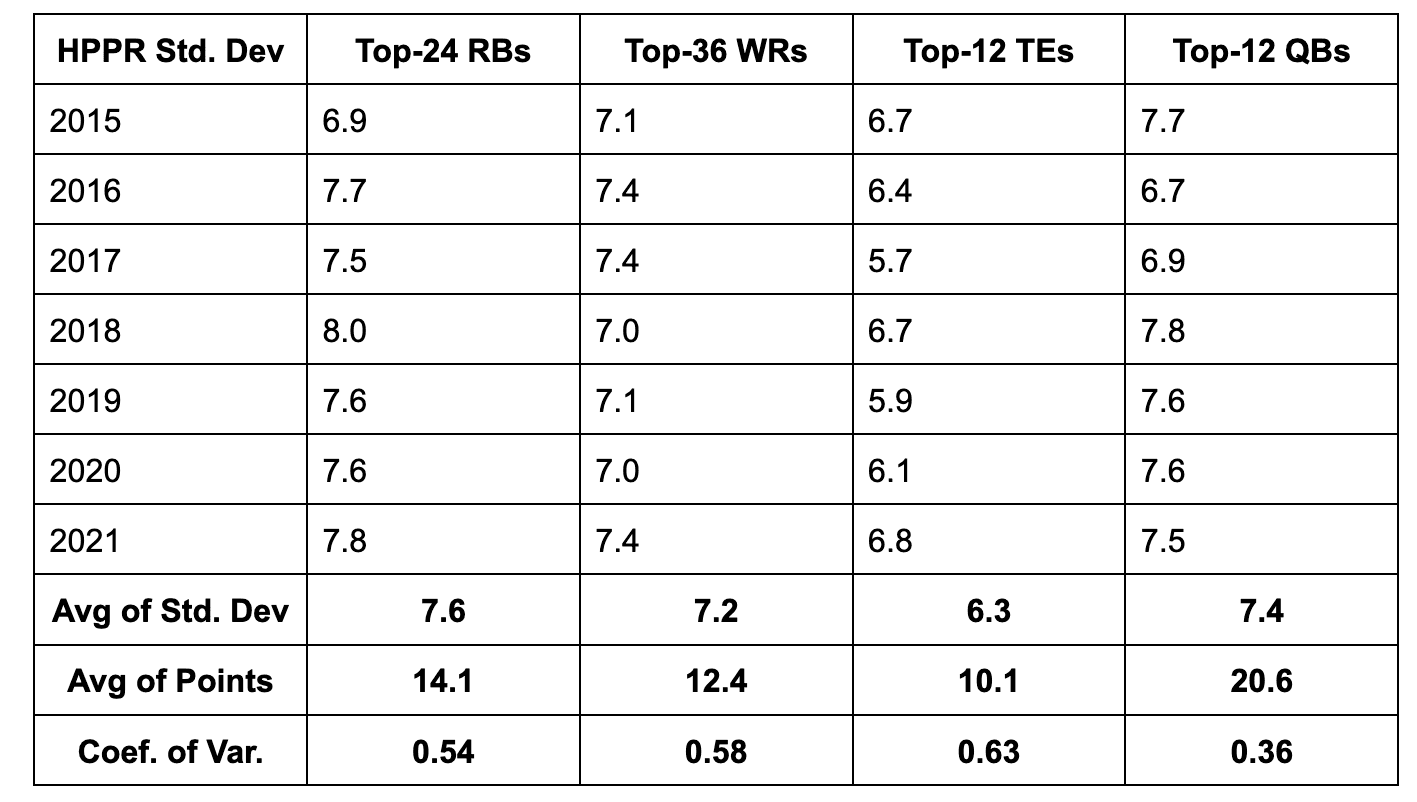
Standard deviation is a measure of volatility. For us, that's how chaotic fantasy scoring is week-to-week. This table shows the standard deviation of weekly half PPR fantasy points over the course of the season for the top-24 RBs, the top-36 WRs, top-12 TEs, and the top-12 QBs in total points over the entire season.
It would seem that the top-24 RBs have slightly more weekly variance based on the metric, but we need to compare standard deviations to their averages to properly measure which position has more weekly variance. Introducing Coefficient of Variation.
Since 2015, the top-24 RBs averaged 14.1 points, the top-36 WRs averaged 12.4 points, the top-12 TEs averaged 10.1 points, and the top-12 QBs averaged 20.6 points. If we divide the standard deviations by the averages listed here to get the coefficients of variation, we get QBs (0.36), RBs (0.54), WRs (0.58), and TEs (0.63), meaning:
The position with the most weekly variation in scoring is tight end, closely followed by wide receiver and then running back. Quarterbacks are – by far – the least volatile position on a week-to-week basis.
This shouldn’t be a surprise. Tight ends are usually not focal points of offenses, so their scoring is more tied to touchdowns compared to wide receivers who typically get more targets, or running backs who touch the ball 10-25 times per game, or quarterbacks who touch the ball literally every single snap. Basically, the more volume the position gets, the less variance they will have.
But does this remain true across the entire position?

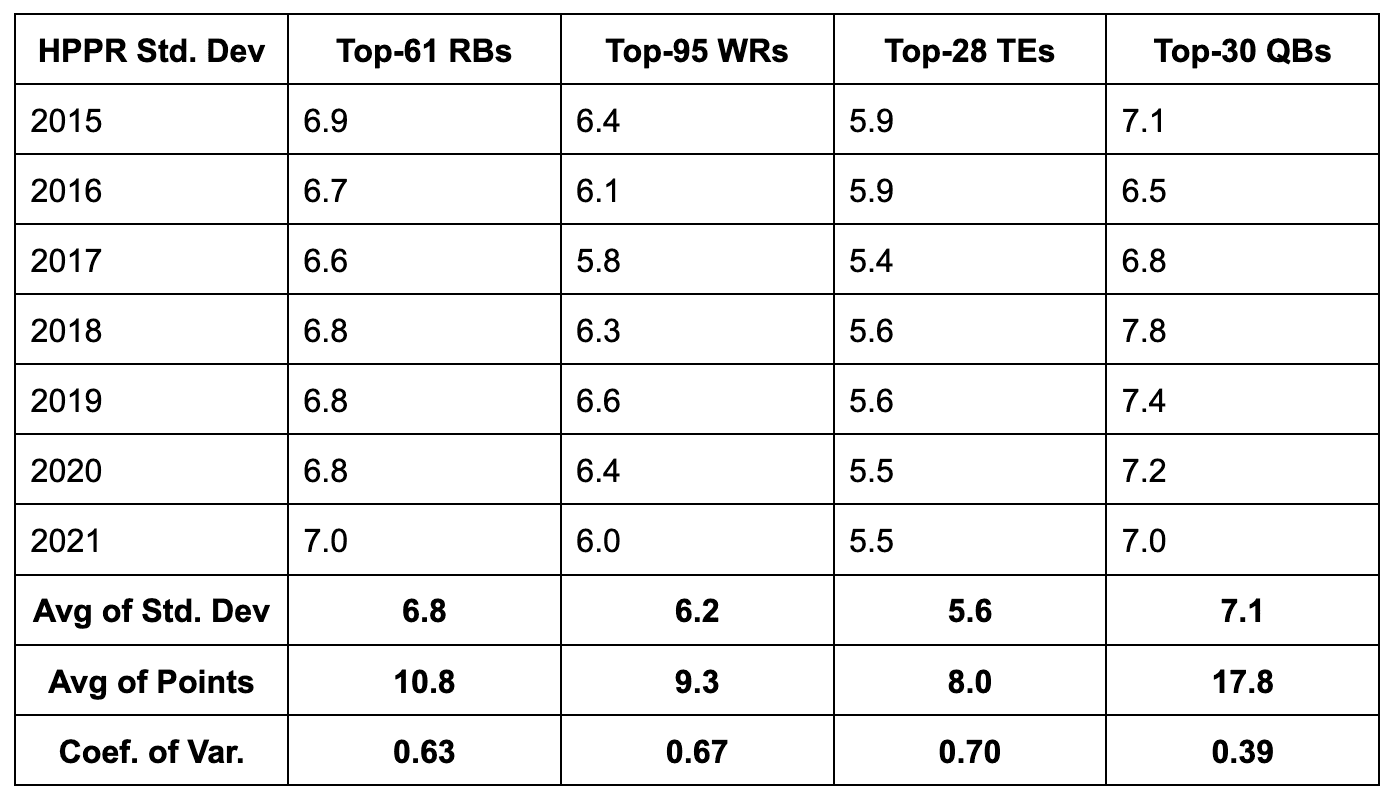
I picked these “Top- __” numbers because Best Ball Mania II drafts averaged 61 RBs, 95 WRs, 28 TEs, and 30 QBs selected.
The top-61 RBs averaged 10.8 points, the top-95 WRs averaged 9.3 points, the top-28 TEs averaged 8.0 points, and the top-30 QBs averaged 17.8 points, which means TEs (Coefficient of variation: 0.7) remained more volatile compared to WRs (0.67), RBs (0.63), and QBs (0.39) when we look at the entire position, not just the top-performers at each position.
Consistently In The Lineup

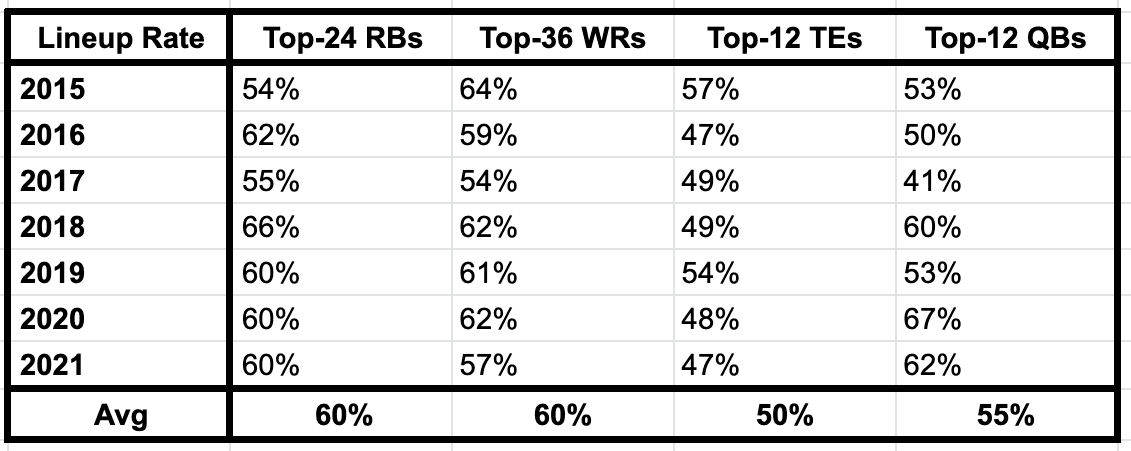
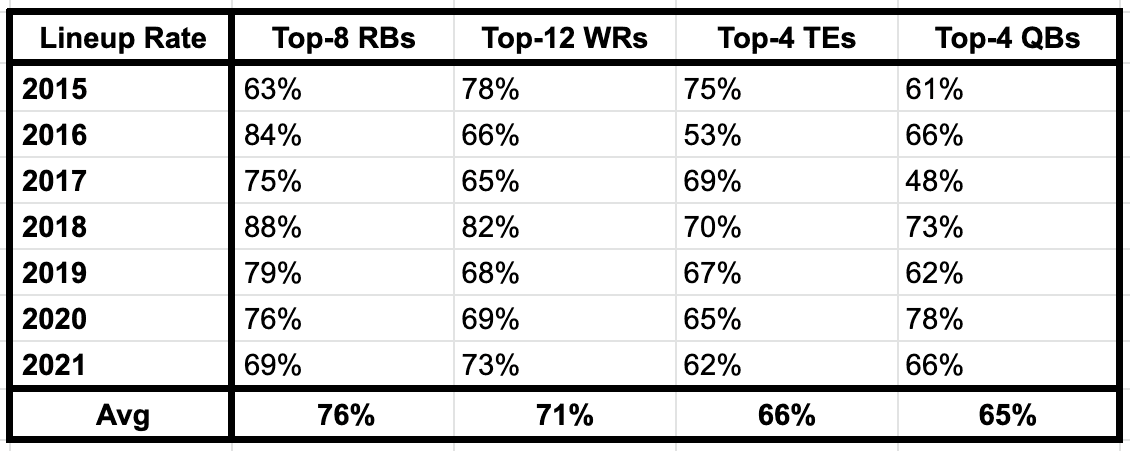
Another way to look at variance is to look at consistency. For us, that means what percent of weeks do the top season-long performers at each position crack the top-24 weekly RBs, the top-36 weekly WRs, the top-12 weekly TEs, and the top-12 weekly QBs. If you're curious: the RB24 in a given week averages 10.5 points, the WR36 averages 9.4 points, the TE12 averages 8.9 points, and the QB12 averages 19.2 points.
The top-24 RBs in total points each season crack the weekly top-24 RB about 60% of the time, which is the exact same rate (60%) as the top-36 WRs in season-long points crack the weekly top-36 WRs. Both of these numbers are notably higher than the top-12 TEs (50%), with the top-12 QBs somewhere in between (55%). This is expected because we just confirmed that TEs are more volatile than RBs and WRs, and because RBs and WRs have very similar weekly volatility.
Now is that true for the elite players at each position?

For the most part, yes it is!
Since 2015, the top-8 RBs in a season have cracked the top-24 weekly RBs 76% of weeks they play, which is a slightly higher rate than the elite WRs (71%), elite TEs (66%), and elite QBs (65%) do at their positions. This is because the elite of the elite RBs are scoring an absurd amount of points over replacement due to their game-script independent workloads. Think Christian McCaffrey, Alvin Kamara, and prime David Johnson type of backs.
But What About The Flex?

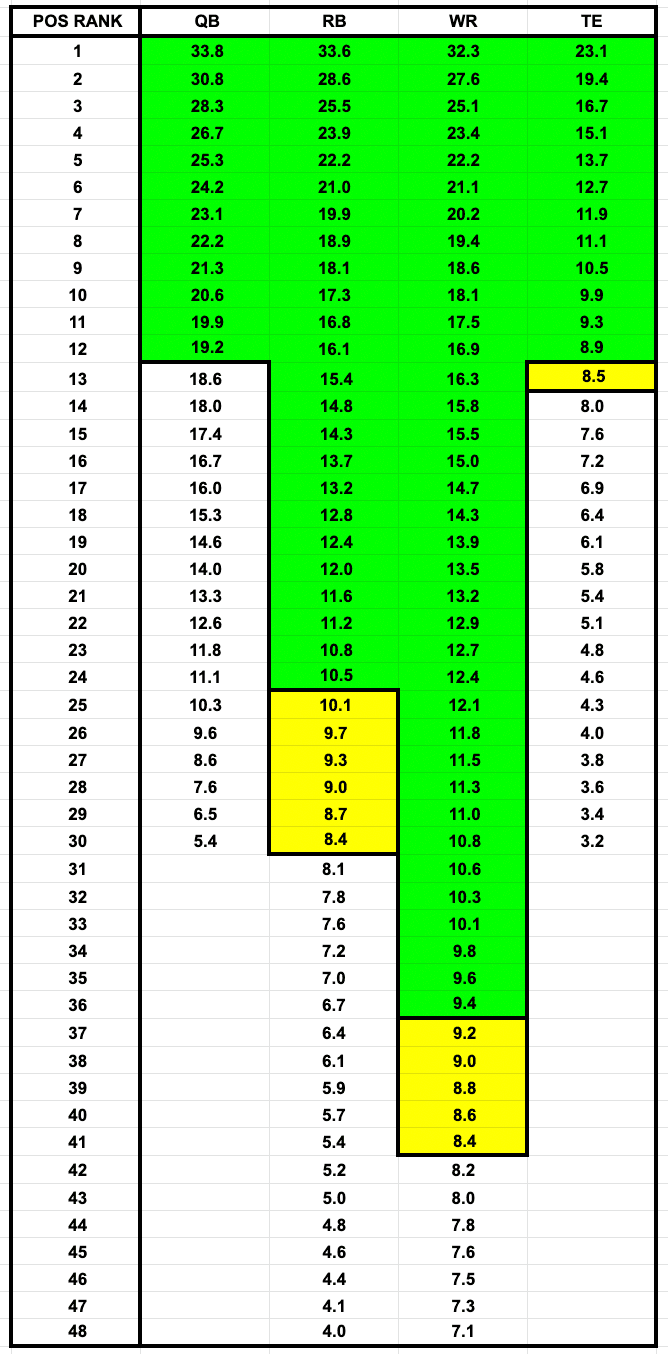
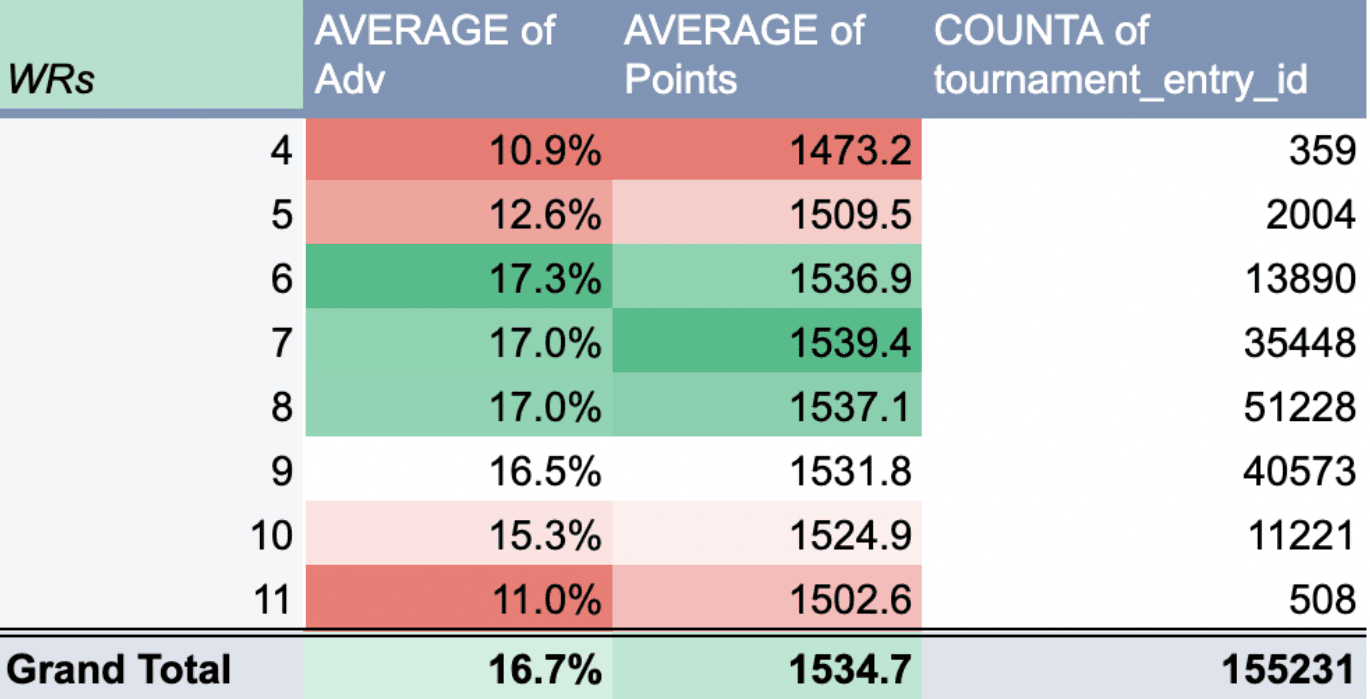
The last thing to consider is the flex spot on Underdog Fantasy. This table (using 2015-2021 data) shows how many points the RB25 in a week scored versus the WR37 in a week, and so on. This will certainly be impacted by how strong your particular best ball team is, but in general about 50% of flex spots should be filled by RBs, 45% should be filled by WRs, and 5% should be filled by TEs ... assuming you're playing on Underdog Fantasy where the starting lineup consists of 1QB, 2RB, 3WR, 1TE, and 1RB/WR/TE flex spot.
I was initially worried that my consistency data was underrating WRs because I wasn't including the flex spot above, but the narrative that we must win the flex by putting a WR in it seems a little overrated in half PPR, as the RB30 scores identical points to the WR40 in a given week. I'll have to dig more into this later. For now, this is more research suggesting that RBs and WRs are pretty, pretty similar in half PPR best ball.
Conclusion
If we were trying to create the most balance team in a vacuum, we'd draft 2.2 QBs, 5.0 RBs, 8.5 WRs, and 2.3 TEs each draft to reflect the amount of starting positions on Underdog Fantasy. But each position scores points differently, so we need to add more to the positions with higher weekly variance to maximize the best ball format.
It's clear that TE is the most volatile position week-to-week (probably because they touch the ball the least) and that QB is the least volatile (probably because they touch the ball the most).
At least in half PPR, RBs and WRs are similarly volatile on a week-to-week basis. The RB and WR studs tend to crack their best ball starting lineups at a slightly higher clip than the stud QBs and TEs, which is why the beginning of fantasy drafts are rightfully filled with RBs and WRs.
But if RBs score more than WRs in general in half PPR and if they are very similar in weekly volatility and if RBs eclipse the legendary 40+ half PPR threshold more often than WRs, why are Underdog Fantasy drafters selecting 5.1 RBs compared to 7.9 WRs???

It's possible that there's a slight edge (and a uniqueness!) in drafting more 7-WR teams and fewer 9-WR teams, while the industry consensus is that WRs have more spiked weeks and volatility than RBs in half PPR. Adding a 3rd QB (the highest scoring position) and a 3rd TE (the most volatile position) could prove beneficial long-term.
But we'll have to let the chaos of the next 5 NFL seasons to play out to truly know what roster construction is optimal, and even then, we'll still need to factor in how often our peers are drafting each build to know what's the best path to a seven-figure prize on Underdog Fantasy. Ultimately, we're playing against each other and not the computer.
And that's what makes this such a great game.